
See Through the Storm.
Guide Every Decision.
One Picture. Every Layer. Connected.
Observatory brings infrastructure, networking, applications, Kubernetes, AI agents, execution traces, security and business services into one picture — and correlates what happens across them.
With AFPM — AI Flow & Performance Monitoring — for the AI layer, plus controlled recovery.
ILLUSTRATIVE ESTATE · TYPICAL SCALE, NOT A CUSTOMER'S DATA
Modern Systems Are
Becoming Harder to Navigate.
Turn Telemetry Into Direction.
As the beam sweeps, noise organizes. Dependencies become visible. Topology forms. Signals correlate into one clear operational map.
Humans and AI Agents
Share One World.
Humans and AI agents operate in the same increasingly complex digital world. Observatory gives both of them the visibility, context and operational intelligence needed to navigate it.
See How AI Actually Operates.
Follow AI execution from the first prompt through models, agents, tools, MCP servers, retrieval systems, applications and infrastructure.
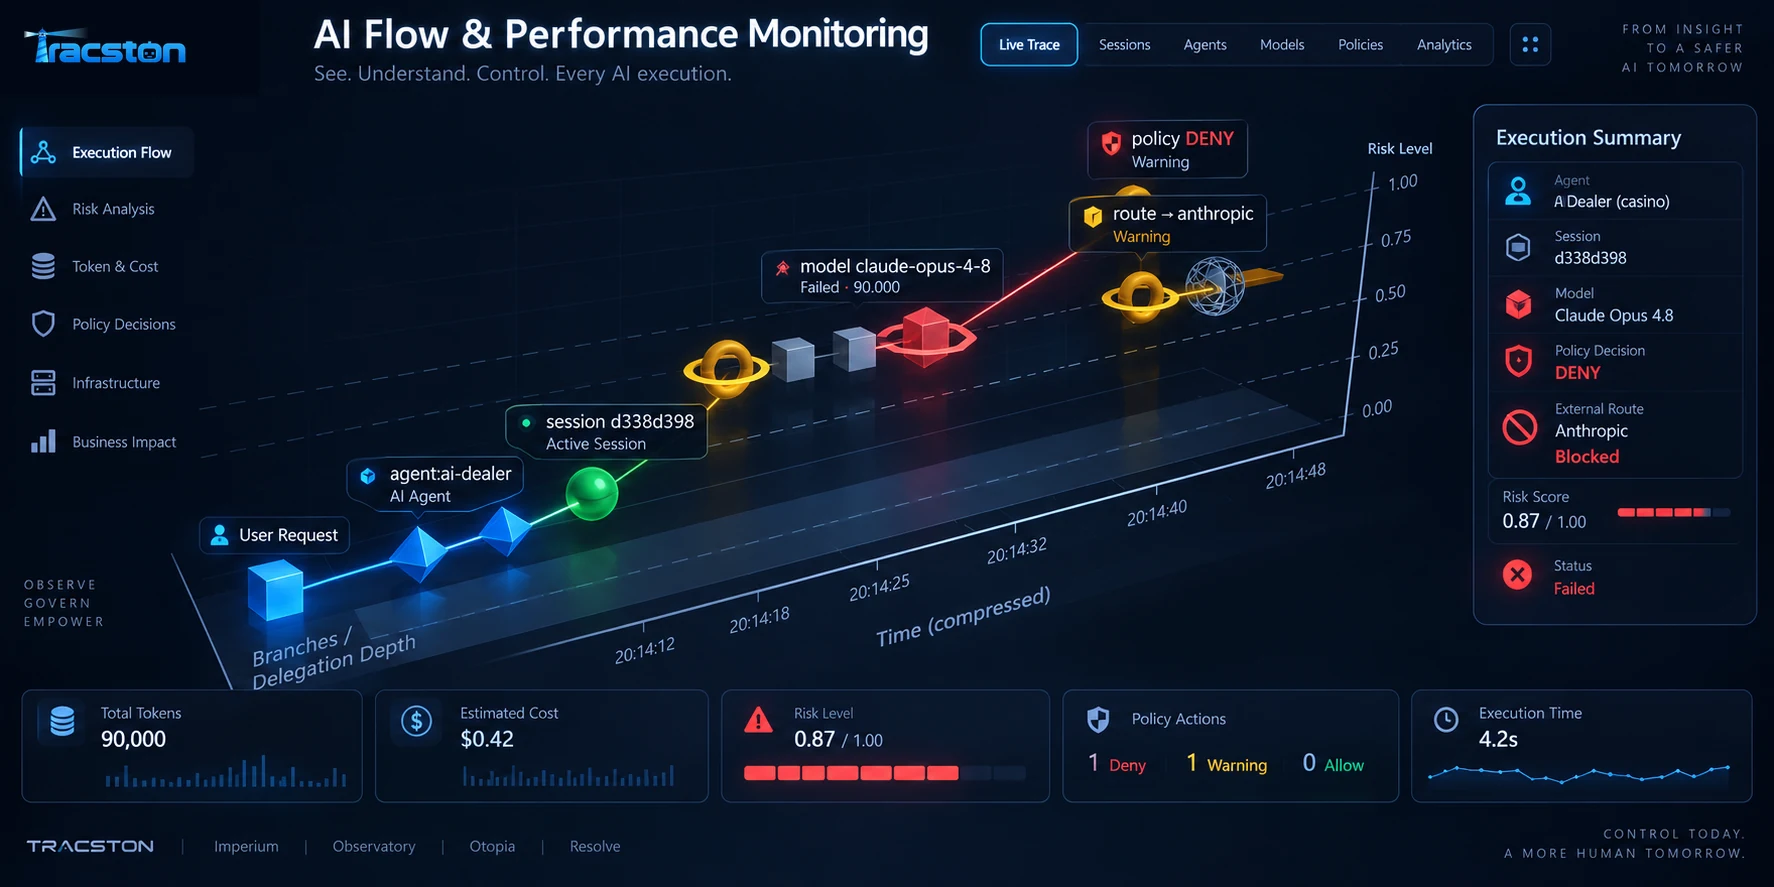
PRODUCT SCREENSHOT — AFPM LIVE TRACE
ILLUSTRATIVE TRACE
Follow the entire AI execution path
Understand requests, routing, models, agents, tools, MCP calls, applications and infrastructure dependencies.
Connect performance to cause
Identify latency, retries, repeated work, resource bottlenecks and failures, with the evidence behind each one.
Measure business impact
Determine whether the mission achieved its intended outcome, not merely whether the individual API calls or agents completed. AFPM reports an outcome only when the source records one; it never infers success from a status code.
Symptoms: response time increased 280%.
When an AI flow fails. AFPM shows where it broke: the model endpoint, the tool call or the step that stalled. Recovery for AI flows is being built on the same policy and approval controls as infrastructure recovery. Self-Healing and AI workflows →
Visibility at Every Depth.
AI doesn't run in isolation. Observatory sees every layer underneath it — from the people and services at the surface to the network and infrastructure at the ocean floor.
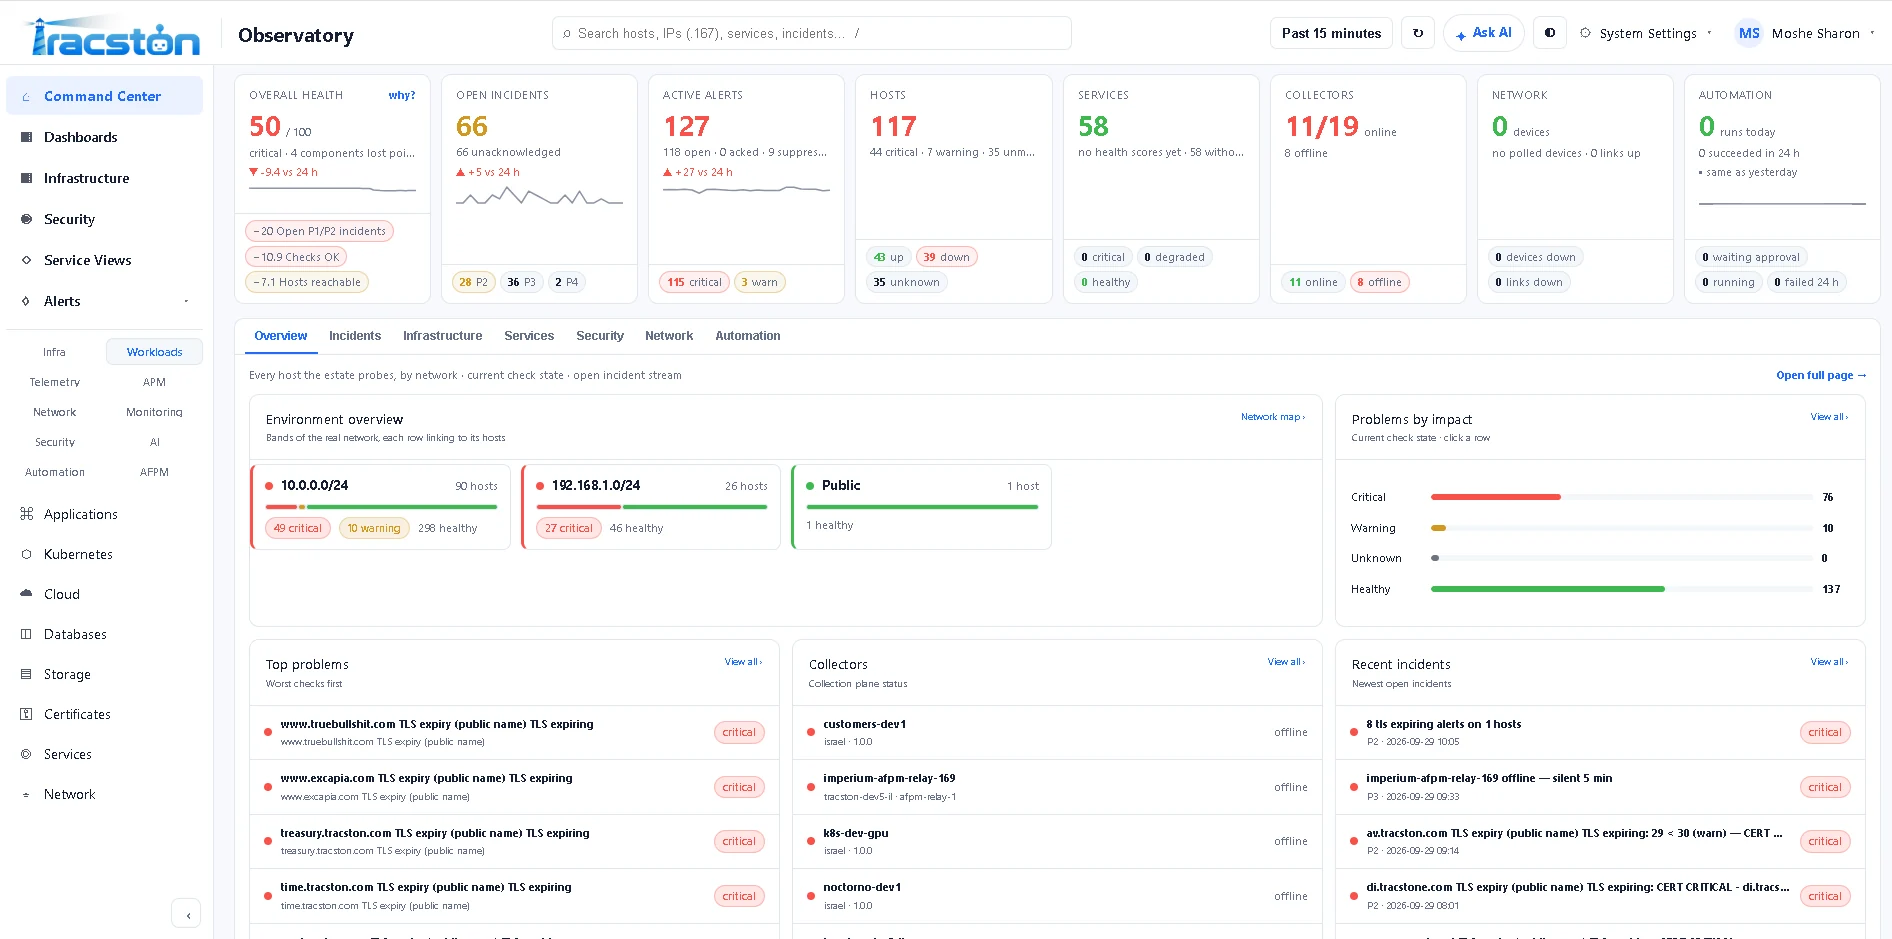
PRODUCT SCREENSHOT — COMMAND CENTER
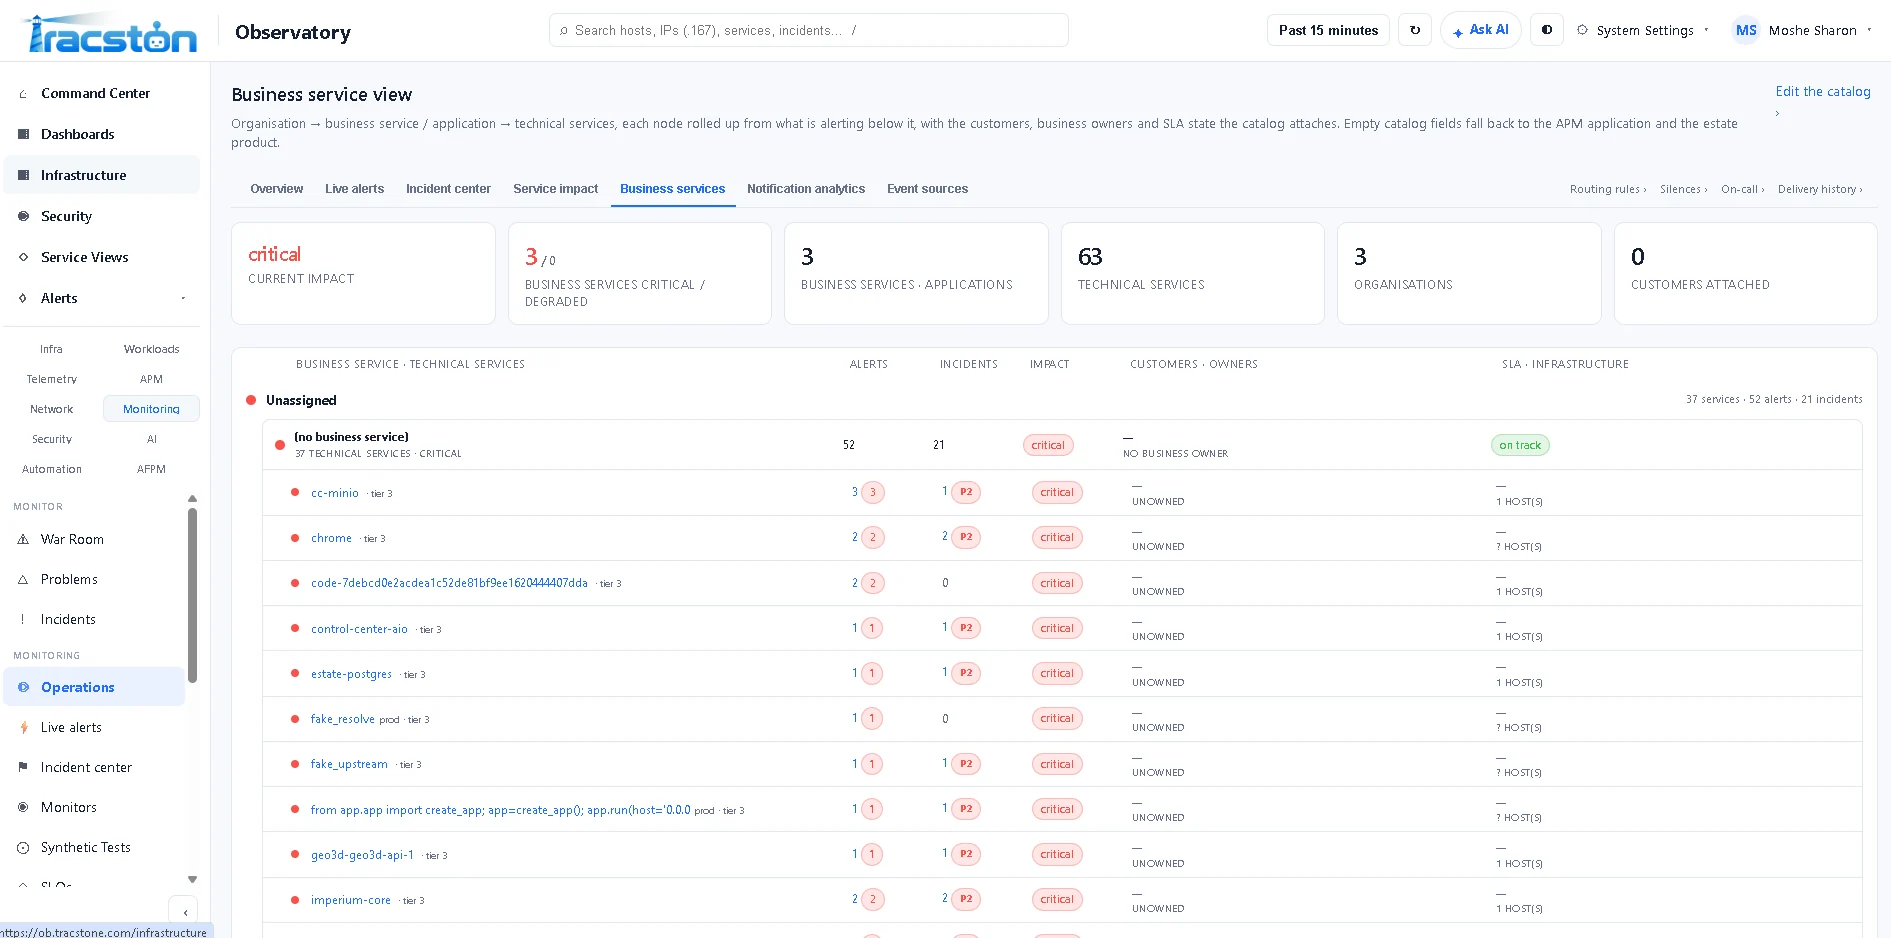
PRODUCT SCREENSHOT — BUSINESS SERVICES
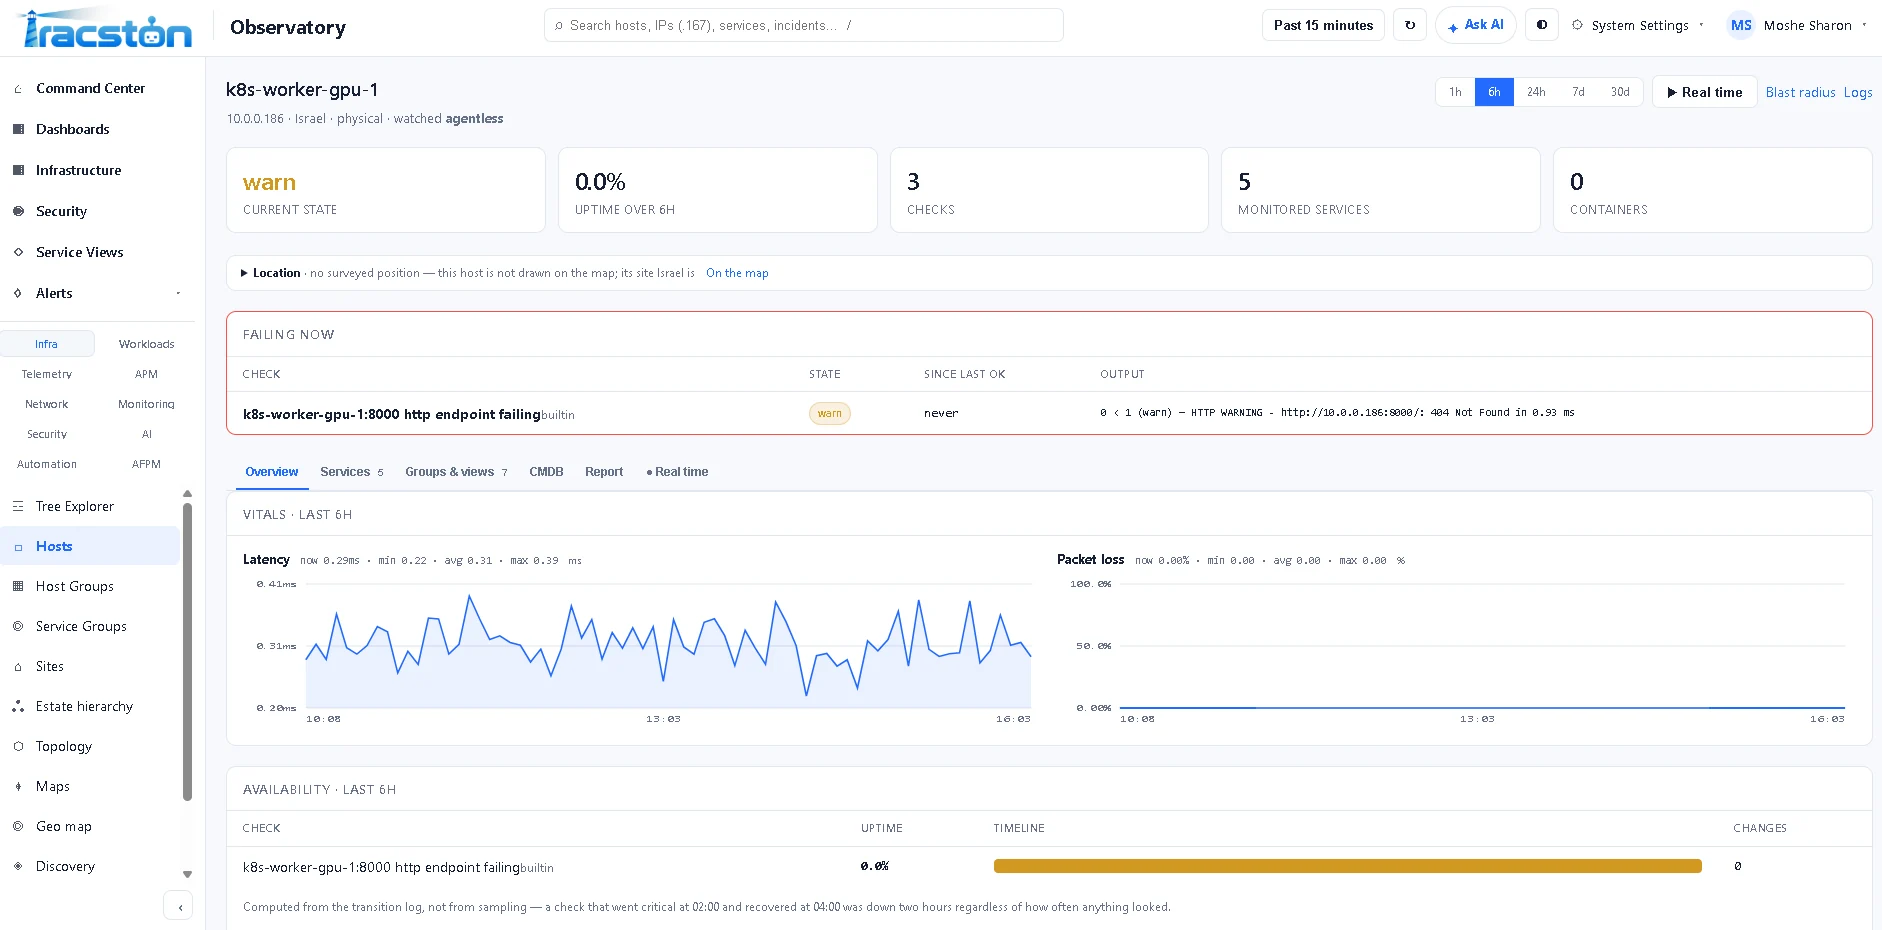
PRODUCT SCREENSHOT — INFRASTRUCTURE
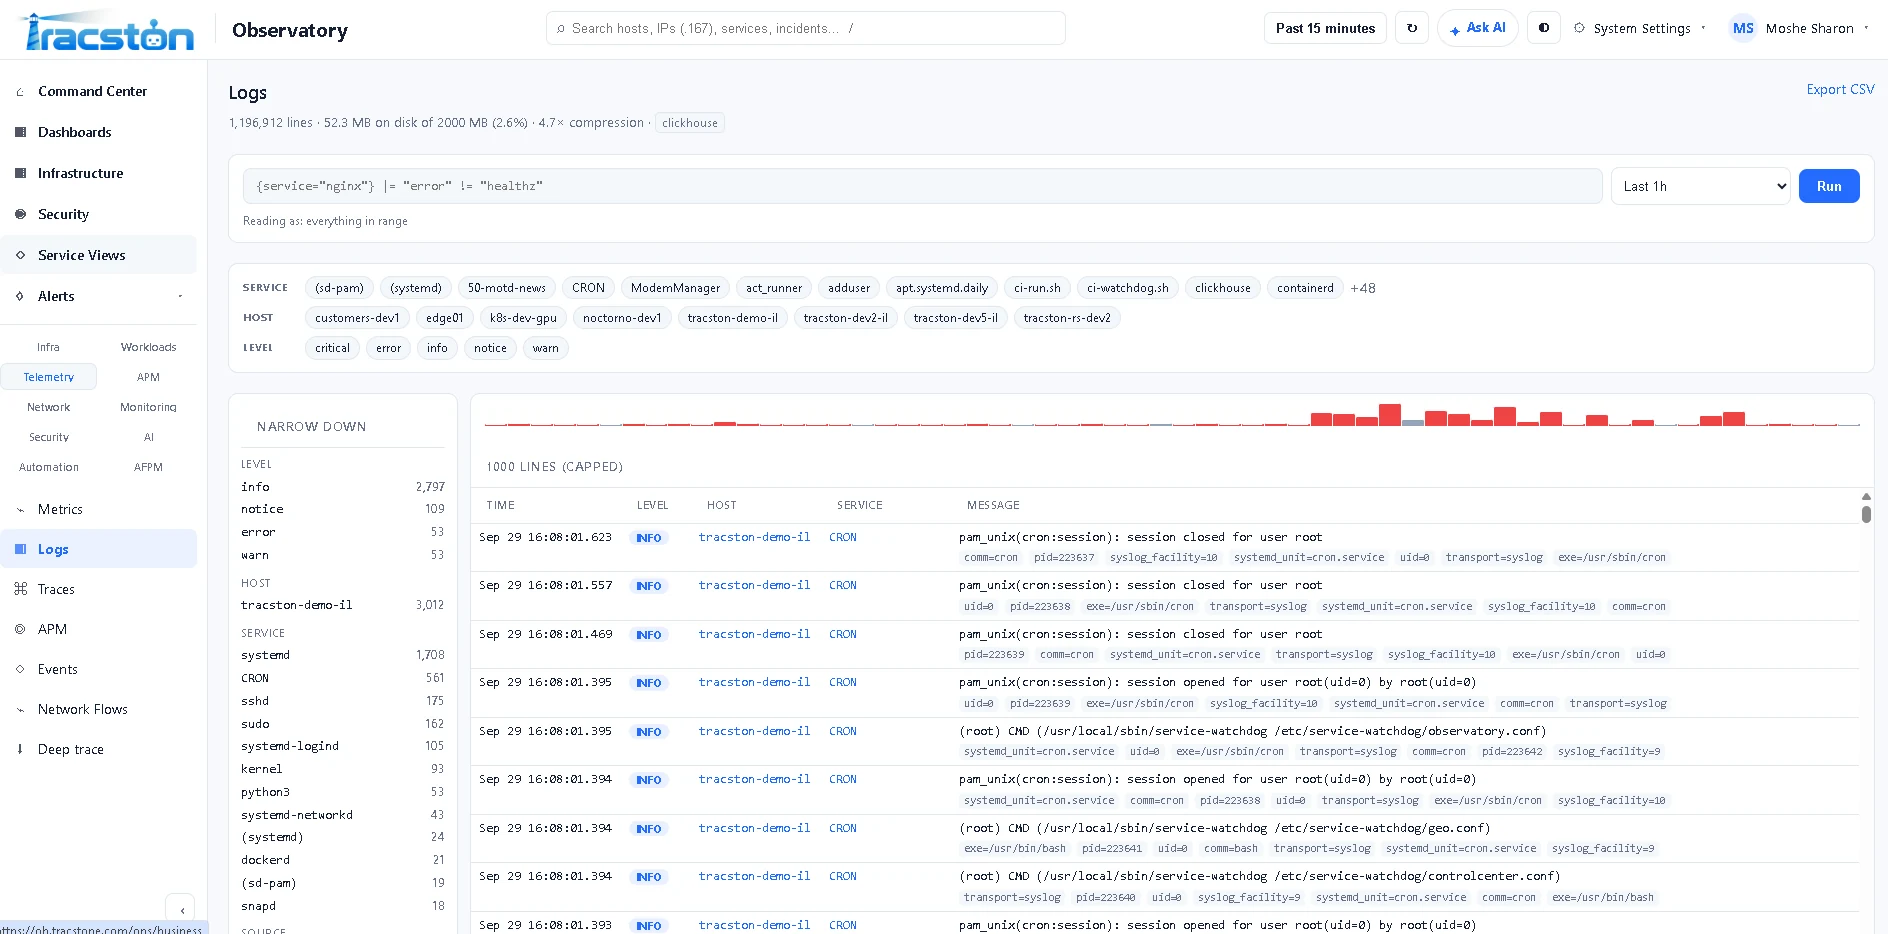
PRODUCT SCREENSHOT — LOGS
Business services guide recovery too. The same business-service dependencies show which applications and users a recovery action could affect before anything changes. Recovery built around services →
Don't Count Alerts.
Understand Incidents.
One system fails. The failure propagates — Database → API → Payment → Checkout → AI Assistant → Customer Experience. Waves become stronger. Telemetry becomes noisy.
- connection wait +430%
- new deployment 4 minutes earlier
- agent concurrency 8× baseline
- API latency correlated
- affected services: 6
AI with operational evidence — not "AI knows everything." Every answer is graded:
From detected problems to verified recovery.
Observatory connects operational signals, service dependencies, and approved recovery workflows to help teams restore service with clear control over every action. Follow the investigation, understand the proposed response, and verify that the service is working again.
- DETECTA dependency fault is picked up by monitoring.
- DIAGNOSEThe affected path is traced and investigated.
- AUTHORIZERecovery policy decides what may run, and who approves.
- RECOVERThe approved workflow runs.
- VERIFYChecks confirm the service works again.
- Likely cause · dependency degraded
- Impact · Orders API → Customer portal
- Evidence · correlated signals and changes
- Service · production
- Mode · approval required
- Approver · authorized operator
- Workflow · approved restart of the dependency
- Resource health
- Application check
- Synthetic check
- A dependency develops a visible fault.
- The lighthouse beam reveals the affected service path.
- An investigation card links the evidence.
- A recovery-policy checkpoint appears: approval is required.
- The approved action progresses.
- Verification checks complete.
- The service returns to a stable state.
ILLUSTRATIVE RECOVERY WORKFLOW · CONCEPTUAL, NOT A PRODUCT RECORDING
Understand the impact
Connect infrastructure symptoms to the applications and business services that depend on them.
Respond with control
Apply recovery policies, approved workflows, and human approval where required.
Verify the outcome
Check service health and user-facing functionality after recovery actions.
Reuse validated knowledge
Turn reviewed recovery experience into reusable workflows for recurring incidents.
One Lighthouse.
Humans and Agents.
Observatory provides humans with understandable operational intelligence and agents with structured context they can safely use to investigate and act.
HUMAN OPERATOR
Incident. Root cause. Evidence. Recommended action.
AI AGENT
Machine-readable operational context, safely scoped.
Runs Where Your Estate Runs.
Four products. One operational story.
Each product runs on its own. When they are deployed together, each one covers a different part of how AI and operations work.
- IMPERIUMAI governance and execution telemetryDecides what each model, agent and tool may see and do, and records what they actually did.tracston.com/imperium
- OBSERVATORYCross-layer operational visibility and correlationConnects infrastructure, applications, AI execution and business services into one picture. You are here.tracston.com/observatory
- OTOPIACollaboration between people and agentsOne shared workplace where agents build in scoped workspaces and people review what moves on.tracston.com/otopia
- EXCAPIAMission execution and outcome validationRuns browser, application and AI-driven journeys and checks they reach the intended result.tracston.com/excapia
Capabilities are enabled according to deployment and licensing. Observatory does not require the other products — they connect when deployed together. Links open www.tracston.com in a new tab.
Choose “A demo of Observatory” on the Tracston contact form, or reach out through your usual Tracston contact.